
Stop Guessing Census Numbers with a Real-Time Senior Living Data Dashboard
Why a Real-Time Senior Living Data Dashboard Matters

A senior living data dashboard gives leaders one trusted view of census, occupancy, labor, revenue, clinical trends, and sales activity. Instead of waiting for a weekly or monthly report, teams can spot a census decline, overtime spike, rising fall rate, or stalled move-in pipeline early enough to act.
Start by tracking a small set of metrics that connect directly to performance:
- Census and occupancy: Move-ins, move-outs, unit availability, lead-to-tour and tour-to-move-in conversion
- Financial health: NOI, revenue per occupied room, rent collections, budget variance, and labor cost
- Workforce stability: Call-offs, overtime, agency hours, open shifts, and turnover
- Resident care: Falls, infections, medication timing, care-level changes, and response times
The value is not another report. It is faster, shared decision-making. When clinical, operational, finance, and marketing data are connected, an executive director can see why occupancy is changing, not just that it changed.
That matters in an industry where fragmented systems remain a major barrier. More than 77% of senior living executives rank interoperability among their top technology implementation challenges. A well-designed dashboard helps overcome that gap by bringing data from systems such as EHRs, payroll, accounting, CRM, and resident management tools into consistent, role-specific views.
For operators, this creates a clearer path to protect NOI, improve staffing decisions, and respond to census risk before it becomes a month-end surprise.
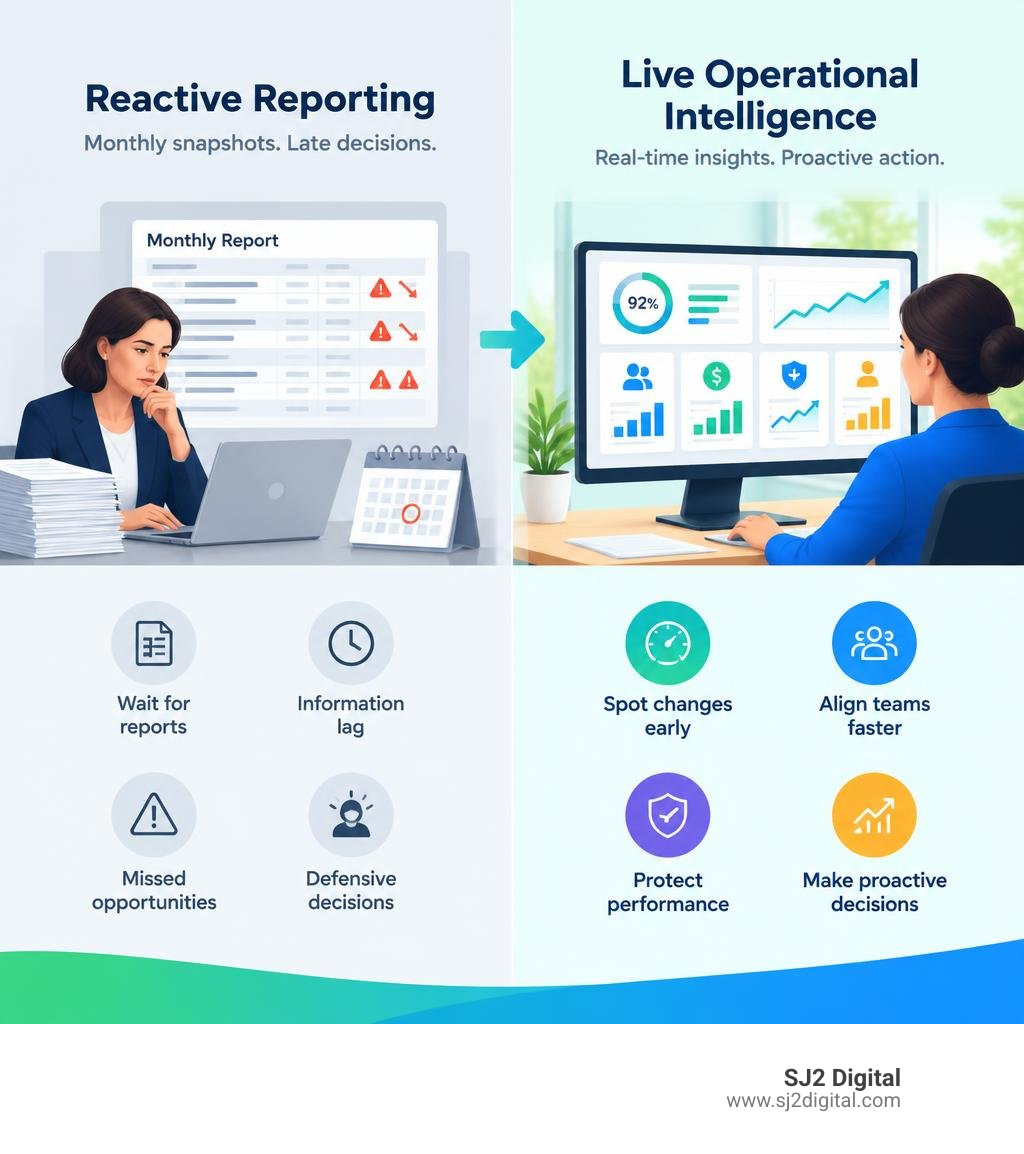
The Shift from Reactive Monthly Reports to Real-Time Operational Intelligence
Relying on monthly spreadsheet packets to run a senior living community is like trying to drive a car by looking exclusively through the rearview mirror. You will certainly see every pothole you hit, but only after your axle is already bent.
Traditional reporting frameworks introduce severe information lag. When census figures, payroll variances, and inquiry logs take thirty days to consolidate, leadership is forced into a defensive posture. By the time an executive director spots a 5% drop in physical occupancy or a sudden surge in premium agency staffing, weeks of net operating income (NOI) have vanished.

Modern operators are replacing this delayed approach with live operational intelligence. Deploying dedicated analytics for senior care portfolios allows community leaders and asset managers to monitor census velocity in real time. Rather than waiting for month-end close to reconcile billing against resident stays, dynamic dashboards synchronize day-to-day admissions, discharges, and upcoming move-outs.
This immediate visibility transforms decision-making across the entire organization:
- Pre-empting Census Slumps: Track lead drop-offs instantly to adjust outreach before occupancy dips.
- Proactive Labor Balancing: Identify overtime buildup midweek instead of finding out during payroll processing.
- Rapid Care Level Adjustments: Align resident acuity shifts with appropriate care billing without multi-week audit delays.
Eliminating Information Lag Across Leadership Tiers
One of the largest hurdles in multi-site management is the communication divide between community-level teams and corporate leadership. Regional vice presidents often spend the first week of every month manually aggregating spreadsheets from individual property managers. This creates inconsistent data versions and slows interventions.
When everyone looks at a centralized intelligence layer, regional alignment happens naturally. If a community in the portfolio experiences a sudden spike in maintenance work orders or a dip in dining engagement, regional directors can offer immediate operational support instead of waiting for a quarterly review. Executive teams gain portfolio-wide visibility, while community teams retain the granular context needed to solve local issues immediately.
Overcoming the 77% Interoperability Challenge in Senior Care
Data fragmentation has historically crippled senior housing analytics. In fact, more than 77% of senior living executives rank interoperability as a top-three barrier to successful technology implementation. A standard community operates on a complex technology stack:
- Electronic Health Records (EHR): Tracking clinical charting, vitals, fall logs, and medication management.
- Enterprise Resource Planning (ERP) & Accounting: Managing general ledgers, accounts payable, and rent rolls.
- Customer Relationship Management (CRM): Capturing inquiry sources, tours, follow-ups, and deposit pipelines.
- Time & Attendance Software: Logging shift coverage, punches, call-offs, and agency utilization.
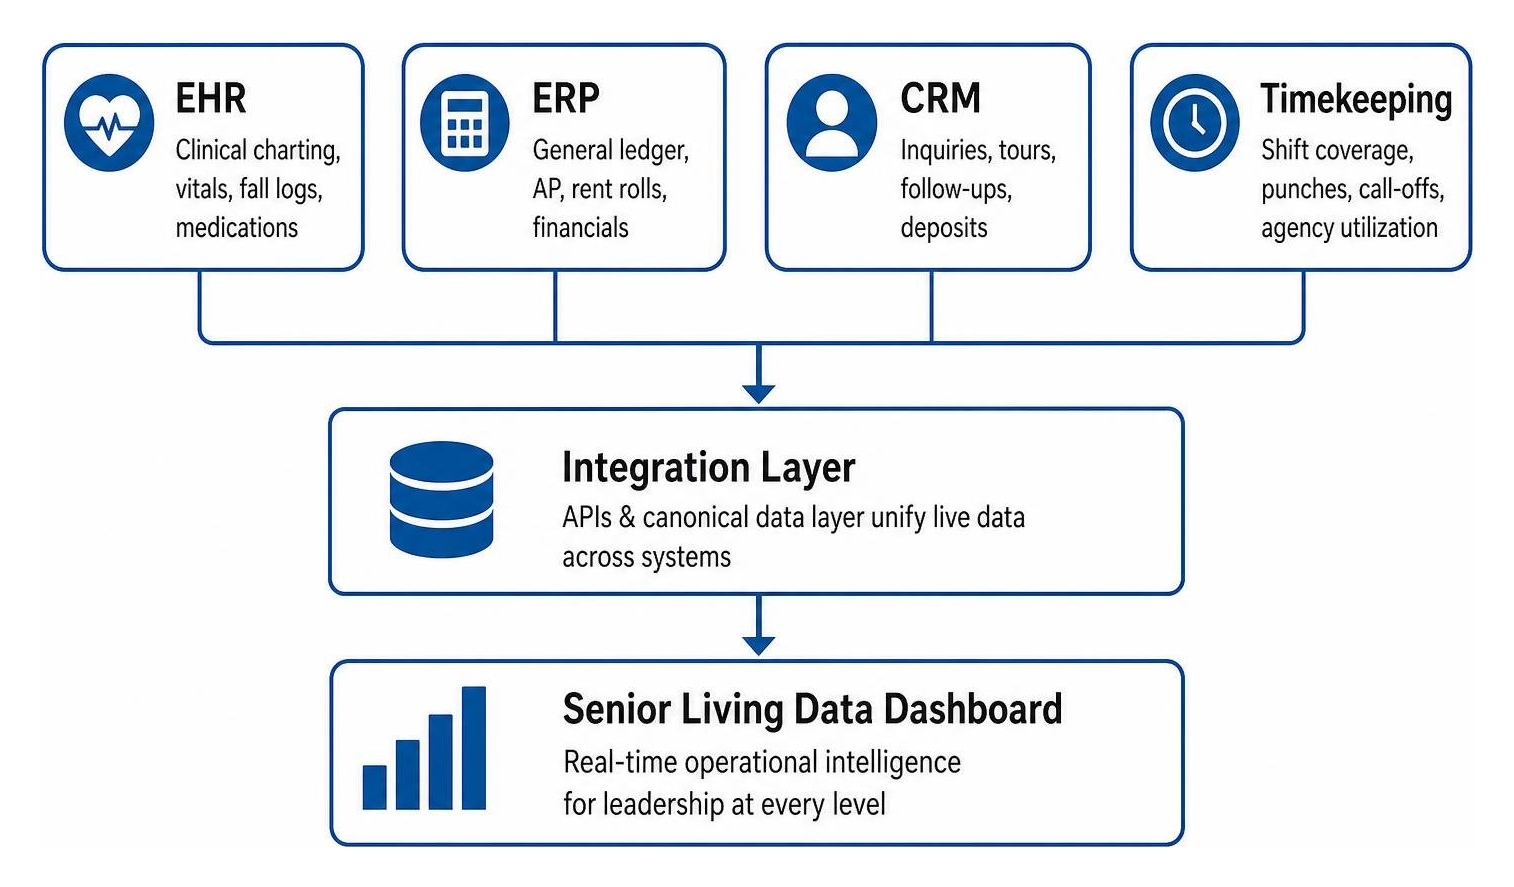
Without a unified architecture, these platforms sit in isolated silos. Operators incur a costly "fragmentation tax"—wasting hundreds of administrative hours copying figures between platforms. Modern business intelligence architectures overcome this barrier by sitting atop your existing systems, pulling live data through standard APIs and canonical data layers without forcing you to replace core software.
Essential Operational, Clinical, and Workforce KPIs to Track
A successful reporting framework is not about visualizing every data point your community generates; it is about surfacing actionable indicators that drive daily outcomes. Reviewing Interactive operational KPI benchmarks helps operators pinpoint where performance deviates from industry standards.
| Metric Category | Traditional Monthly Report View | Real-Time Operational Dashboard View | Immediate Action Enabled |
|---|---|---|---|
| Occupancy & Census | Month-end physical census snapshot | Daily census velocity, planned discharges, available beds | Reallocate digital ad spend to struggling floor plans |
| Labor & Staffing | Bi-weekly overtime dollar total | Real-time shift gaps, open hours, rolling weekly overtime | Rebalance shift schedules before overtime triggers |
| Financial Yield | Static month-end RevPOR | Dynamic RevPOR reconciled with daily acuity levels | Update level-of-care charges matching actual care delivered |
| Clinical Events | Retrospective monthly fall & incident report | Rolling 24-hour incident trends and acuity changes | Adjust night-shift nursing ratios in high-fall wings |
| Sales Conversion | Total monthly tours completed | Lead response times, inquiry-to-tour velocity | Trigger follow-up workflows for stalled sales leads |
Integrating Clinical and Care Records into Your Senior Living Data Dashboard
Clinical care and financial sustainability are inseparable. When a resident experiences a change in physical condition or cognitive acuity, it impacts direct-care hours, staffing ratios, and service tier pricing.
Integrating EHR data into an executive dashboard surfaces subtle clinical patterns before they escalate into acute crises. For instance, if incident tracking shows a cluster of falls occurring between 6:00 PM and 8:00 PM in memory care, leadership can immediately shift staff allocations to improve supervision.
Tracking care-level mix alongside clinical assessments ensures that communities deliver high-quality care while capturing appropriate service fees. When acuity shifts go unrecorded in the billing record, communities effectively subsidize care out of pocket. Live tracking reconciles resident care plans with operational billing records automatically.
Workforce Management: Combating 35% Turnover and Overtime Spikes
Labor represents the largest operating expense in senior housing, as well as its greatest operational vulnerability. Operators face an average annual turnover rate of 35%, making retention and staffing efficiency paramount.
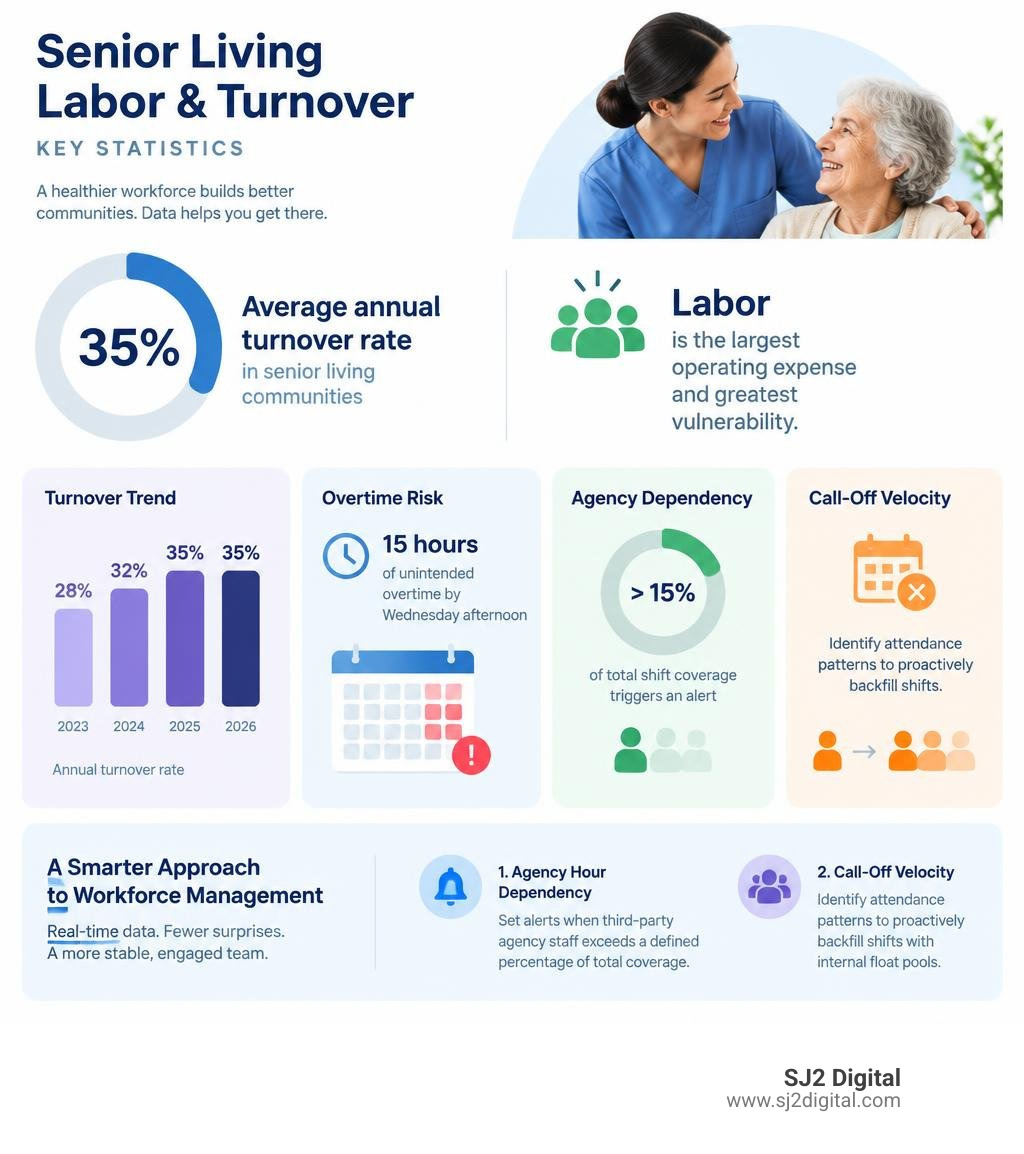
When workforce tracking relies on delayed timesheets, overtime creeps into schedules unnoticed. By Wednesday afternoon, a caregiver may already be on track for fifteen hours of unintended overtime, inflating labor costs and accelerating staff burnout.
A unified analytics layer tracks labor metrics dynamically:
- Agency Hour Dependency: Set alerts when third-party agency staff exceeds a defined percentage of total shift coverage.
- Call-Off Velocity: Identify attendance patterns to proactively backfill shifts with internal float pools.
- Overtime Trajectory: Surface employees nearing forty hours early in the pay period to redistribute upcoming shifts.
Addressing scheduling friction directly reduces employee fatigue, helping communities stabilize their workforce and protect margin performance.
Driving Financial Performance and Census Growth with Connected Analytics
Sustained financial health requires absolute harmony between marketing lead generation and operational census management. If community inquiries stall, occupancy inevitably drops sixty to ninety days later.
Operators must understand the demographic macro trends shaping the market. For instance, by 2035, one in three American households will be headed by someone 65 or older. Regional shifts are even more dramatic: Colorado is the third fastest-aging state in the nation, and in Maryland, the 85-and-over cohort is the fastest-growing segment of the aging population. In fact, by 2030, one in every four Marylanders will be over 60. Meeting this surging demand requires communities to build responsive digital acquisition engines supported by comprehensive senior living SEO.

Financial KPIs to Monitor in a Senior Living Data Dashboard
Tracking top-line revenue alone can hide severe operational leaks. A comprehensive financial view unifies several distinct revenue and expense streams:
- Net Operating Income (NOI): Live tracking of operating margins against monthly community targets.
- Revenue Per Occupied Room (RevPOR): Analyzing the blend of base rent alongside personalized care fees.
- Rent-Roll Reconciliation: Ensuring that resident contracts, rent escalations, and move-in concessions match the general ledger in real time.
- Budget Variance by Department: Monitoring controllable costs, such as culinary supply orders and maintenance expenses, against seasonal forecasts.
Automating these views spares finance leaders from spending days on manual reconciliations during month-end closes.
Connecting Marketing Funnels to Move-In Conversions
Occupancy issues are rarely solved by simply buying more leads; they are solved by understanding lead quality, velocity, and conversion bottlenecks.
By integrating your CRM with advertising platforms, leadership can track which marketing channels produce high-intent inquiries versus tire-kickers. Communities can drive high-intent inquiries through targeted senior living pay per click campaigns and capture families searching within specific geographic radiuses using targeted programmatic advertising for senior living.
Connecting your advertising channels to tour and deposit data makes acquisition costs completely transparent:
- Lead Response Time: Measure how quickly sales counselors contact web inquiries.
- Inquiry-to-Tour Rate: Identify friction in scheduling physical or virtual walkthroughs.
- Tour-to-Deposit Ratio: Pinpoint which floor plans or care levels face pricing objections.
- Move-In Velocity: Track the average days elapsed from initial phone call to signed resident agreement.
Core Features of a Modern Senior Living Data Dashboard
Not all dashboard tools are created equal. Generic business intelligence tools often require months of custom modeling and expensive outside consultants to configure. An effective senior housing analytics solution provides native industry models out of the box.
When evaluating solutions, leadership should prioritize the following capabilities:
- Automated Anomaly Detection: Machine-learning algorithms that flag outlier events, such as an unexpected spike in medication errors or an unusual surge in tour cancellations.
- Granular Drill-Down Capacity: The ability to transition from a 30,000-foot portfolio summary down to a single community, wing, or resident invoice with a single click.
- Configurable Threshold Alerts: Automated notifications sent directly to department heads via email or SMS when critical metrics cross preset limits (e.g., agency usage exceeding 8% of total hours).
- Native API Connectivity: Seamless, bi-directional data flow across EHR, CRM, ERP, and payroll systems without manual CSV uploads.
Role-Based Views from Caregivers to the C-Suite
An effective analytics deployment presents data tailored to the specific responsibilities of each user role:
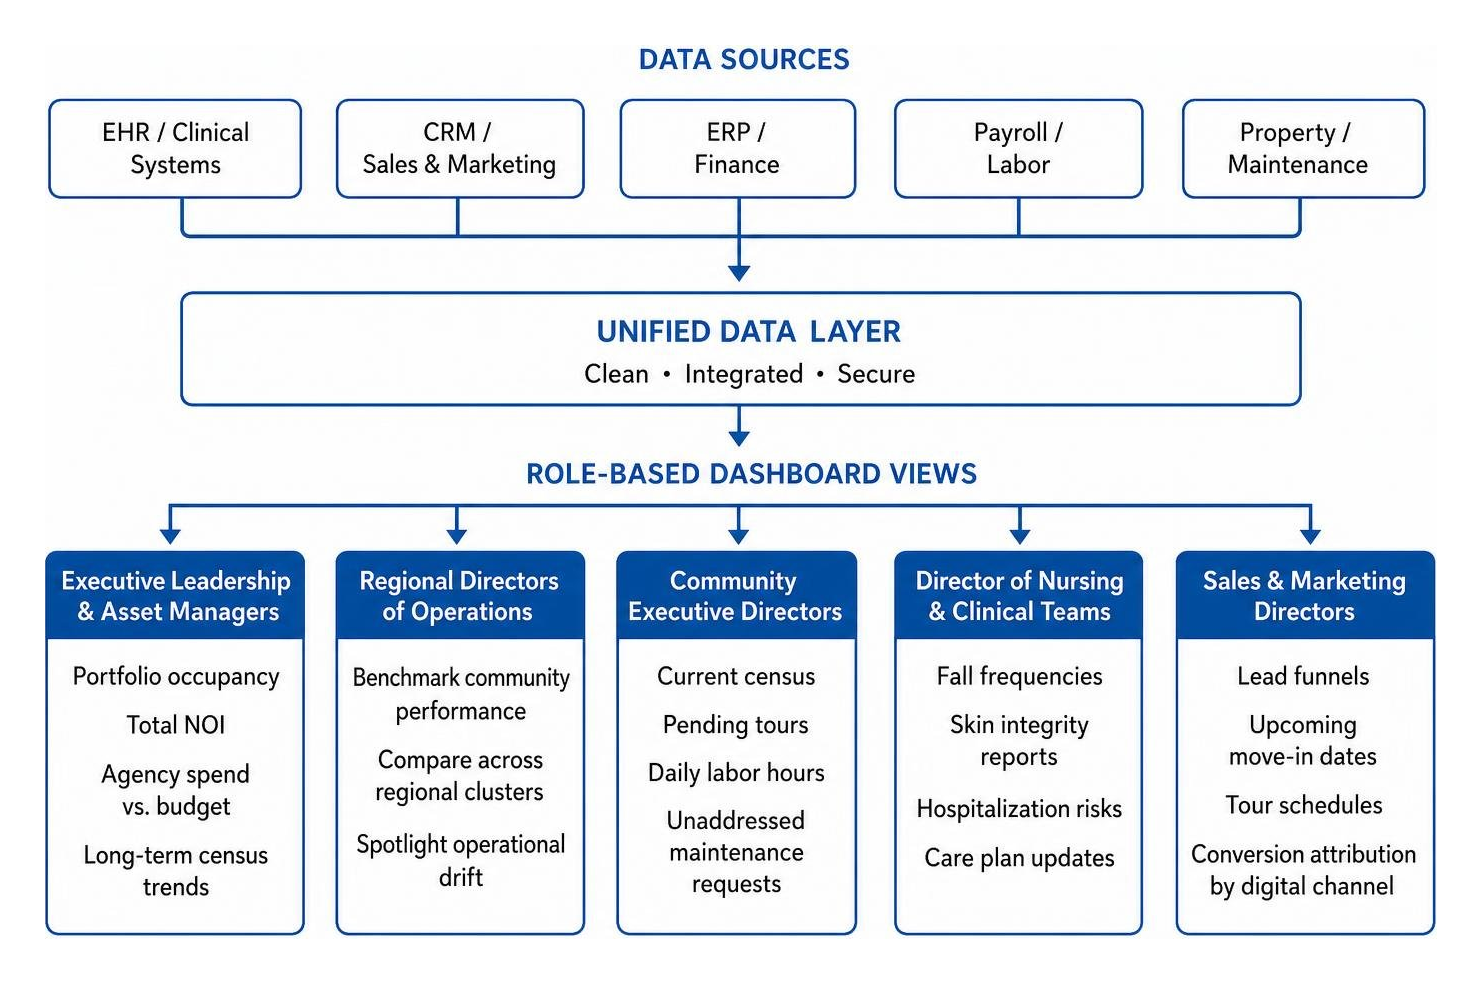
- Executive Leadership & Asset Managers: High-level summaries displaying portfolio occupancy, total NOI, agency spend vs. budget, and long-term census trends.
- Regional Directors of Operations: Comparative dashboards benchmarking individual community performance across regional clusters to spotlight operational drift.
- Community Executive Directors: Daily operational command views showing current census, pending tours, daily labor hours, and unaddressed maintenance requests.
- Director of Nursing & Clinical Teams: Patient-centered views focusing on fall frequencies, skin integrity reports, hospitalization risks, and care plan updates.
- Sales & Marketing Directors: Lead funnels, upcoming move-in dates, tour schedules, and conversion attribution by digital channel.
Data Hygiene and Industry Benchmarking Standards
A dashboard is only as reliable as the underlying data it ingests. Establishing standardized data hygiene rules ensures that every community in your portfolio logs admissions, departures, and labor categories using identical parameters.
Furthermore, combining your internal metrics with external demographic and regional benchmarks provides essential market context. For example, knowing that adult day health care averages approximately $117 per day in states like Maryland, or assessing regional poverty and caregiver availability (where only 5% of family caregivers have formal activity-of-daily-living training), helps operators price their respite, memory care, and assisted living tiers accurately against local alternatives.
Frequently Asked Questions About Senior Living Analytics
Why are traditional monthly reports no longer sufficient for senior living operations?
Traditional monthly reports deliver historical summaries too late for proactive intervention. If an assisted living community experiences an unexpected drop in inquiries or a sudden spike in staffing overtime at the start of the month, a monthly reporting cycle leaves leadership unaware of the financial damage until thirty to forty-five days later. Real-time dashboards eliminate this lag, allowing teams to adjust marketing, staffing schedules, and clinical resources immediately.
How does a data dashboard improve resident care and clinical outcomes?
By aggregating records from Electronic Health Records (EHR) and incident logs in real time, dashboards surface emerging clinical trends before they lead to acute health events or hospital readmissions. Clinical leaders can spot recurring fall patterns by time or location, monitor weight loss trends across wings, evaluate medication administration delays, and adjust shift-by-shift nurse-to-resident ratios based on current resident acuity.
What systems must integrate into a senior living BI platform?
A comprehensive senior living data dashboard should connect four foundational operational systems:
- Electronic Health Records (EHR): For clinical documentation, care plans, and incident tracking.
- Customer Relationship Management (CRM): For sales pipelines, tour scheduling, lead sources, and move-in conversions.
- Enterprise Resource Planning (ERP) & Accounting: For rent rolls, accounts payable, care billing, and general ledgers.
- Time, Attendance & Payroll: For tracking daily clock-ins, open shifts, overtime thresholds, and third-party agency labor hours.
Turning Data Visibility into Census Growth
Operating senior living communities has never been more complex. Between shifting regional demographics, labor constraints, and rising care demands, running a portfolio on gut feeling and stale monthly reports is no longer sustainable.
At SJ2 Digital, we believe transparency drives growth. We operate as an agile digital marketing partner for senior living communities, utilizing an "anti-agency" model with no long-term contracts, transparent live dashboards, and hands-on senior experts who manage your spend like their own. By connecting your online acquisition pipeline—from strategic senior living social marketing to paid search campaigns—directly to your move-in data, we ensure every marketing dollar translates into sustainable census gains.
Schedule a consultation today to replace reporting guesswork with real-time operational clarity.